Services
Dispatch Stats endeavors to serve the Emergency Services Districts in Texas to provide leading edge reporting capabilities. We know many agencies don’t have the internal resources available to create this type of comprehensive data reporting so our approach is to work with the agency to take that burden and create meaningful insights into your agency’s operational and response picture. From call types and locations to response times and more, we can create a one-time snapshot or a regularly updated portfolio that is designed specifically for you. Arm yourself with important data points to see how your department is performing.
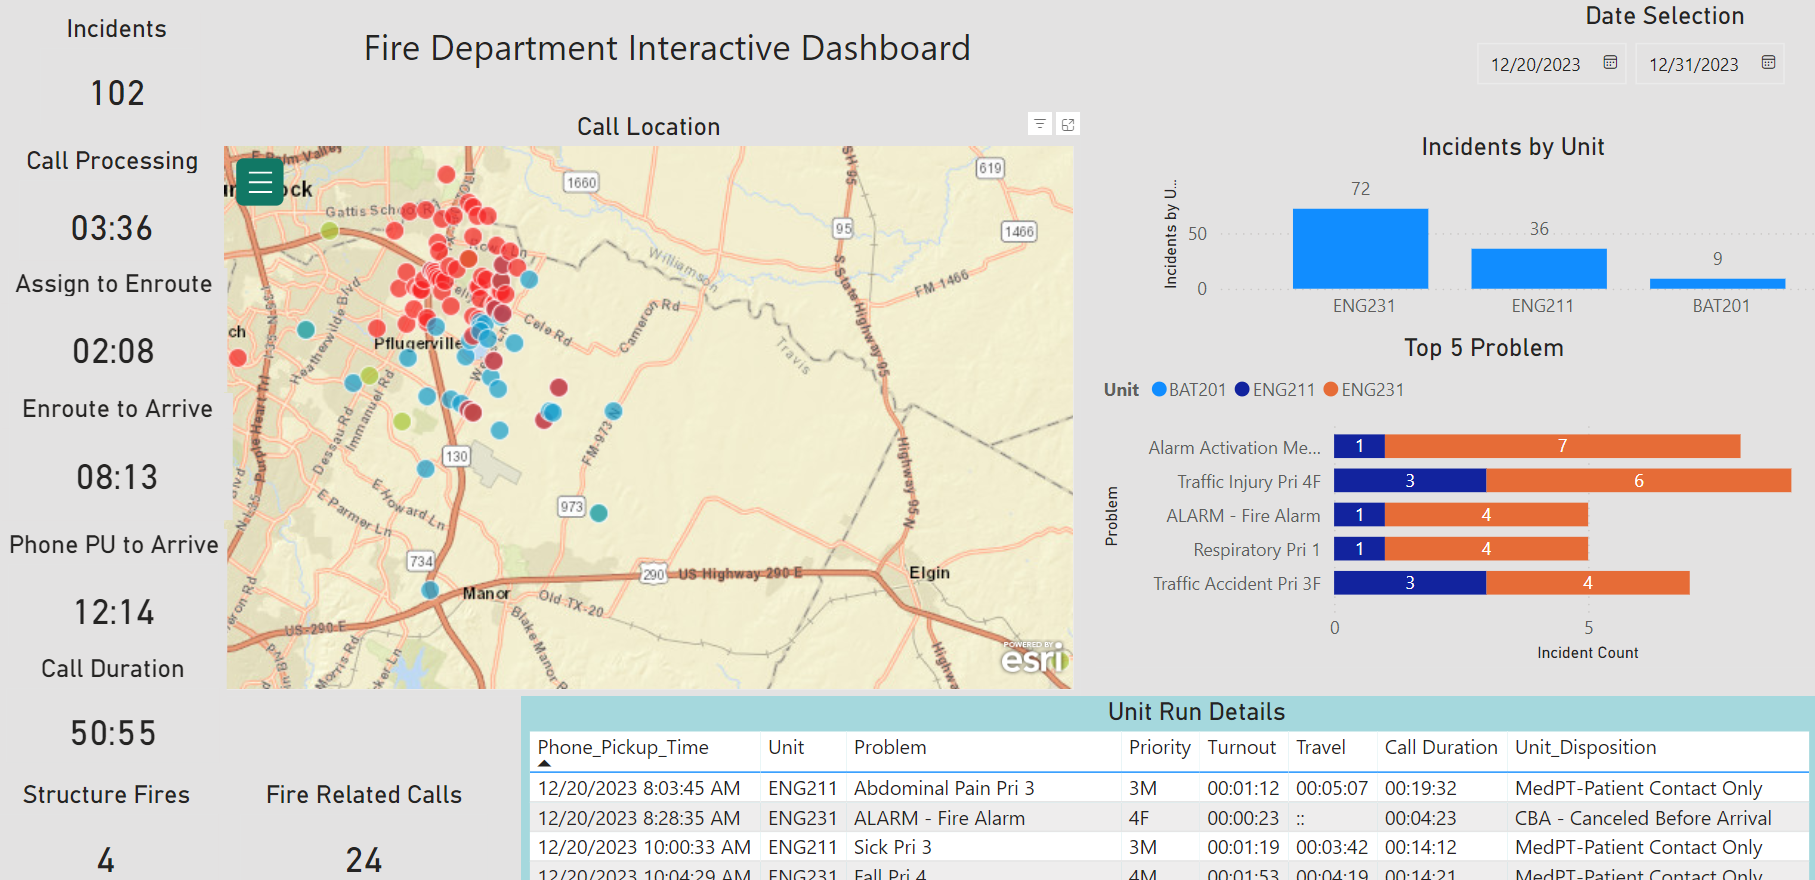
Using your dispatch agency’s report (or raw) data, we create immersive, visual graphics and dashboards that are fully intertwined, allowing mouse click filtering to “see” the data in many different ways. Filter by date, call type, unit, location, or virtually any data point in the call record to view one call’s details or a year’s worth to get a clear picture of your agency’s operating environment. Taking the same data, we create interactive maps that can show call locations and embed them into with thousands of available layers to create intelligent maps to tell the story of where. Our interactive dashboards and maps can get you the data you need to do meaningful analysis of your department. Reporting capabilities dependent on CAD and/or RMS data available.
•Measure dispatch center performance.
Sample Data Points
•Incident counts
•Incidents by problem
•Incidents by unit
•Call processing time
•Dispatch, turnout and travel times
•Time and call count trending
•ERF Response *
•Incident duration
•Incident location
•Units busy at same time
•Unit utilization
Dashboards
- Data is presented in a visual and relational format.
- Additional reporting, such as NFIRS information, can be created from RMS system reports.
- Measure department, shift, and unit performance including turnout time, travel time, and call duration.
- Calculate unit busy at same time and utilization.
- All time calculations can be done to average, mean, or percentile.
- See where and when calls are happening and all associated times.
- All reports are created from CAD dispatch records and are dependent on the data provided from the dispatching agency.
Interactive Maps
Using ArcGIS, we can create maps that incorporate your call data with thousands of publicly available map data layers. Using advanced analytics tools, we can calculate travel distances and time from your stations. See what 6 and 8 minute (or any time you desire) travel time coverage looks like, and overlay them on your jurisdiction boundaries, properties, or on your tier II storage sites. See how many calls your units are responding to outside of their response boxes, and then drill down to determine why. All of this and much more is available at the click of a mouse. Let us show you how.

